Creating a Waterfall Chart in 5 Steps
By Wyn Hopkins
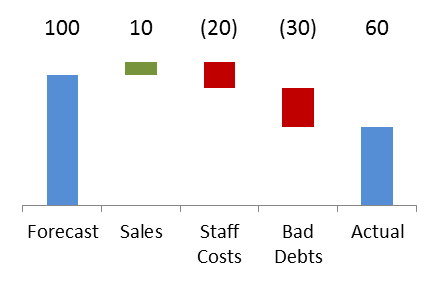 A waterfall chart is a great way of illustrating the causes of differences between two data points. The most common being Actual v Forecast or Current Year v Prior Year.
It can be quite a tedious manual process to create this chart, however using Up Down bars you can create an automated waterfall chart really easily.
Alternatively, if you have Excel 2016+, waterfall charts are built-in. Excel 2016 Charts
More Information & Free Example File:
![]()


