Data-Driven Decisions
Case Study: Using PowerPivot and Power BI to Drive Strategy
By Jeff Robson

A national recruitment company provided us with some data from their internal systems about the placements they were making around Australia.
The data included all sorts of information:
- Demographic information: age, nationality, location, etc
- How long it took to place the person
- What industry they were placed into (ANZSIC standard industry code)
… and many other fields.
Because their data included the ANZSIC standard industry code, we were able to use Excel’s PowerPivot functionality to link this with data from the Australian Bureau of Statistics about the growth or decline of each industry.
Combining these together then allowed us to compare the number of placements in each industry with the growth of that industry … and it produced some very interesting results.
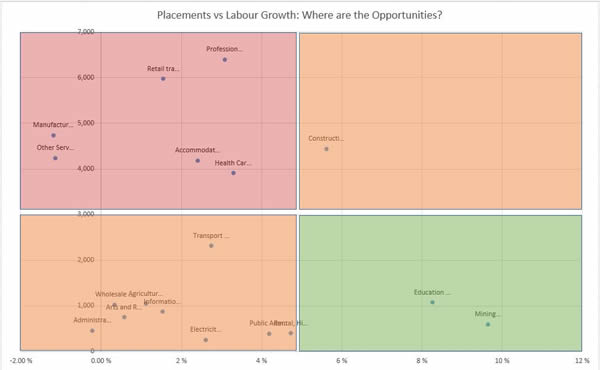
The chart above showed that the company had been placing most of their candidates into industries that were either declining or growing relatively slowly (red box).
This prompted the company to consider whether this was the best strategy, or whether there were bigger opportunities to service industries that were growing much faster (green box) … something they hadn’t considered before as they didn’t have the data to support their analysis.
It’s a simple example of how combining internal data can often be linked and combined with external data to produce new insights about various areas of business.
What Insights Could you get?
If you’re like most companies, there may be many opportunities like this to make more use of your data, derive more value and get valuable insights about new opportunities, ways to reduce cost, or ways to reduce risk.
Let us know if you’d like to have a chat, call +61 8 6210 8500, e-mail info@accessanalytic.com.au
Need Help? Data Analysis Consulting Services


