Data Analytics is the New Black
Why everyone is so focussed on improving their data
By Jeff Robson
Businesses want to be more efficient, save costs, & improve revenues.
These reasons are almost always the primary goals for implementing new systems. So why don’t they achieve their goals?
The #1 reason is analytics (aka “reporting”, “big data”, or “data science”)!
That’s why in 75% of businesses today, improving this area is amongst their top 3 priorities. It’s also why the Harvard Business Review named “Data Scientist” the “Sexiest job of the 21st Century”!
- To become more efficient, you need information about where the inefficiencies are: what’s working and what isn’t.
- To save costs, you need information about where the dollars are currently being spent, are there any anomalies, what is the cost per unit (not just the total cost), how has this been changing over time etc.
- To increase revenues, you need to work out what’s currently selling, why, and to whom … then figure out how to find more people just like your existing buyers, who you can cross-sell and up-sell to, and what other products/services would suit your customers.
But without the facts, without the supporting data and analysis, you’re just guessing. And getting the facts often provides some really surprising insights about what’s happening with your customers, suppliers, employees, costs, revenues … and why.
- Example 1: the retail chain that monitors store activity in real-time to identify busy and quiet periods then moves staff between stores accordingly to achieve higher customer satisfaction while reducing staff costs.
- Example 2: the construction materials company that identified new markets and increased profitability by mapping its existing new home sales to housing starts. This allowed the company to measure its market penetration and thereby identify new places to focus on.
- Example 3: the app/web developers that use analytics to test every new feature and change in their products to determine where to place features, what words/colours/pictures generate the most sales, and how to increase user responses/actions.
Because most business intelligence systems have historically been so expensive, smaller and medium-sized businesses have had to either use some very manual processes for producing their reports the way they want them, or simply accept what each of their different software systems can produce.
Not anymore!
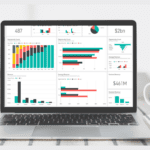
Solutions such as Microsoft Power BI allow organisations to continue using familiar software like Excel with a web browser to build, deliver and view data reporting solutions in a very cost-effective manner that’s fast, secure and easy to amend as the business changes.
Where do you Start?
It seems that everyone is talking about making more use of their data but at a practical level, what does this mean for you? Because let’s face it: you need to see this kind of stuff with your own data in it, otherwise it won’t make sense.
The “Dummies” Guide to Getting Started
- Pick a useful area where you already have some good quality data: operational, financial, HR, engineering … whatever is going to be easiest and deliver the biggest wins.
- Engage a consultant (or a few consultants if you want to compare) to prepare a small proof-of-concept for you using your data. If you try to do it yourself, you won’t know the tools so it’ll take longer and won’t be as impressive.
- After you’ve explained to the consultants what the data means, see what insights they can deliver for you.
- Pick the one(s) you like and present these to your management team so they understand what the project is all about, appreciate the value and can commit more resources.
- Expand the scope so you can develop a more complete solution then implement and iterate.
- Rinse and repeat after you’ve bedded this down to expand to other areas of the business.
- Don’t limit your thinking to just the data you have internally. Investigate what other data is available from outside your business that could also be useful e.g. website statistics, Microsoft Azure data market, cloud systems …
Who to Talk to
If you’d like to chat about your specific situation, just let us know.
Jeff Robson, CEO, Access Analytic
+61 8 6210 8500 or jrobson@accessanalytic.com.au


