Stop zeroes displaying on line Charts
I have a line chart which has all the months of the year displayed. Each month is linked to a data cell. This means that future months display zero values.
The line chart drops down to zero for these future months.
Instead of having to change the chart range each month I want to stop the chart plotting the zero values for the future months.
Is this possible?
Yes!
Excel 2016+
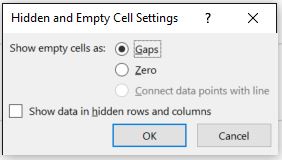
Go to Chart Tools > Select Data > Hidden and Empty Cells then choose the behaviour you want to see.
This affects blank cells, cells with #N/A! errors and hidden cells.

Excel Versions < 2016
You can use Excel’s feature of not plotting error values on charts to stop it displaying the zero values.
You need to modify the formula to display #N/A if the value is zero.
For example if the cell contains the formula =C2 you would amend the formula to =IF(C2=0,NA(),C2).
Another option could be to hide the columns or rows involved.
If you hide columns or rows in the chart’s source data then none of the hidden data appears on the chart.


