Excel & Power BI Dashboard Reporting
In today’s volatile business environment, more and more organisations are implementing Excel & Microsoft Power BI dashboards and reports to measure their key performance indicators (KPIs).
Excel Dashboards can be dynamic and look great, especially when you understand Pivot Charts and Slicers. This is the type of Dashboard we teach attendees to create during our Excel Productivity training course.
Using Excel and Power BI to build dashboards and reports is an excellent way to get started because they’re familiar, flexible, fast and inexpensive.
Excel and Microsoft Power BI can:
- Connect to all your various data sources & relate the data together
- Store and manipulate hundreds of millions of rows of data very quickly
- Design beautiful, interactive maps and dashboards with drill-down & filtering capabilities
- Publish all these to the web for viewing by anyone using any device with a browser
- Automatically refresh the data so you’re always looking at the most up-to-date information
What gets Measured gets Managed
You can’t manage, improve and optimise an area of business without measuring it. Often, just measuring something starts to improve it because it tells people, “This is important!”
A well designed Excel dashboard is an excellent way to simplify complex information from multiple sources and display this in a way that is easy to understand … and utilise for decision-making.
“Jeff is an expert in all things finance and Excel related. Checkside have engaged Jeff and his team at Access Analytic on a number of occasions to create financial and KPI reports for our business. Jeff and his team are professional, personable and reliable and I recommend Access Analytic to my clients with confidence. I’ve also attended a number of workshops, presentations and speaking engagements that Jeff has presented – his international reputation as an expert speaker and trainer is well deserved!”
Scott O’Hehir, Director, Checkside
Dashboards in Excel
Here are the key elements to consider when building dashboards in Excel:
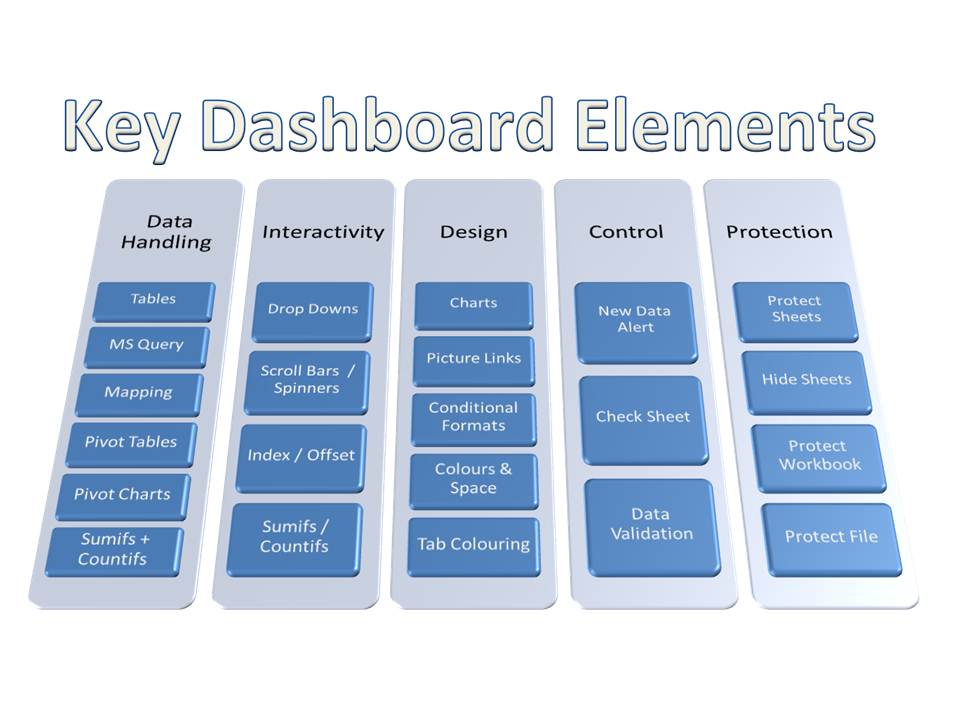
Dashboard Design
Dashboards come in all kinds of different designs and levels of functionality, depending on their purpose. Here are some examples of dashboards built in Excel for our clients:
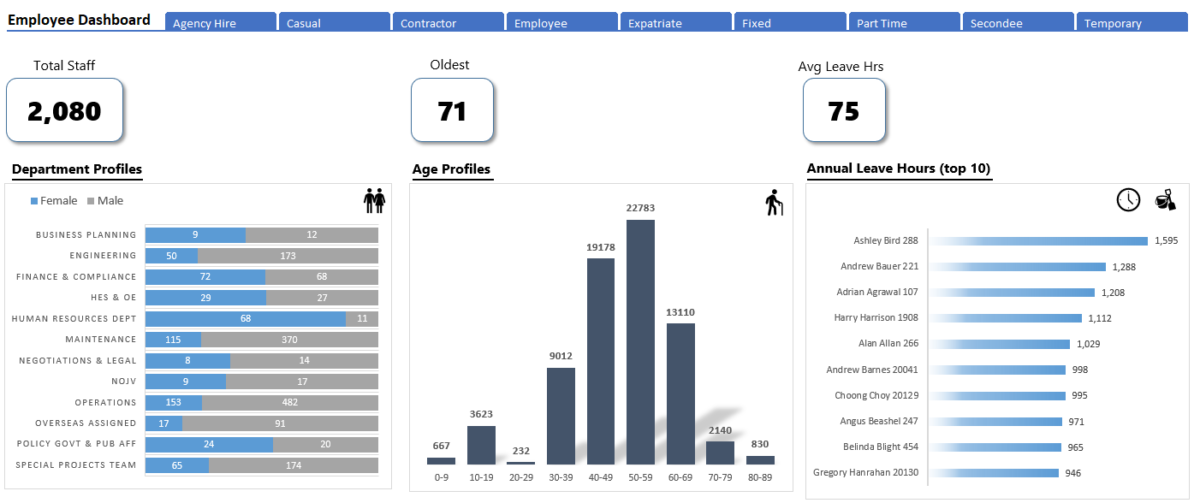
Example: Human Resources
This is one part of an Excel dashboard solution we developed for the HR department of a large client. It was designed to reduce clutter & communicate information quickly and easily.
Key components were grouped together using subtle visual clues. Some interactivity was included (e.g. to change department) and the data was updated live from a variety of client databases behind the scenes.
Example: Live Boardroom Papers
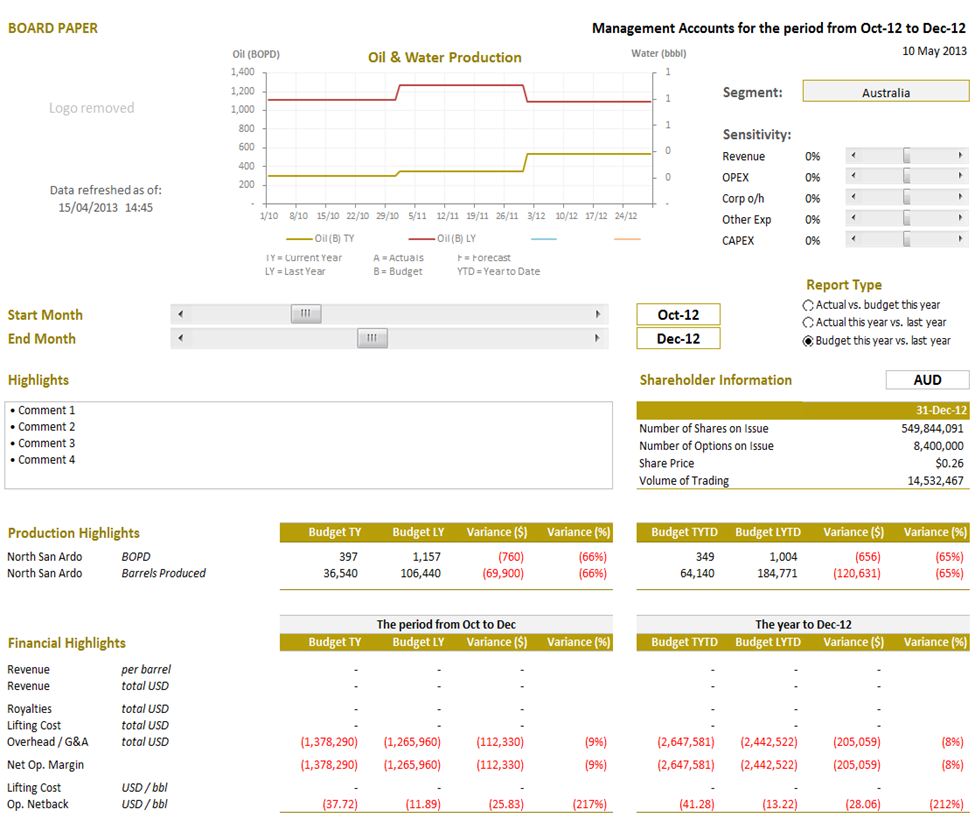
This Excel-based dashboard solution downloaded data from the client’s ERP system to present in an interactive Board pack that directors could use live in board meetings to produce what-if scenarios around revenue, operating expenditure, overheads, and capital expenditure projects.
In addition, the model allows the directors to examine the results over different time periods and turn on/off actuals, budgets and comparative figures.
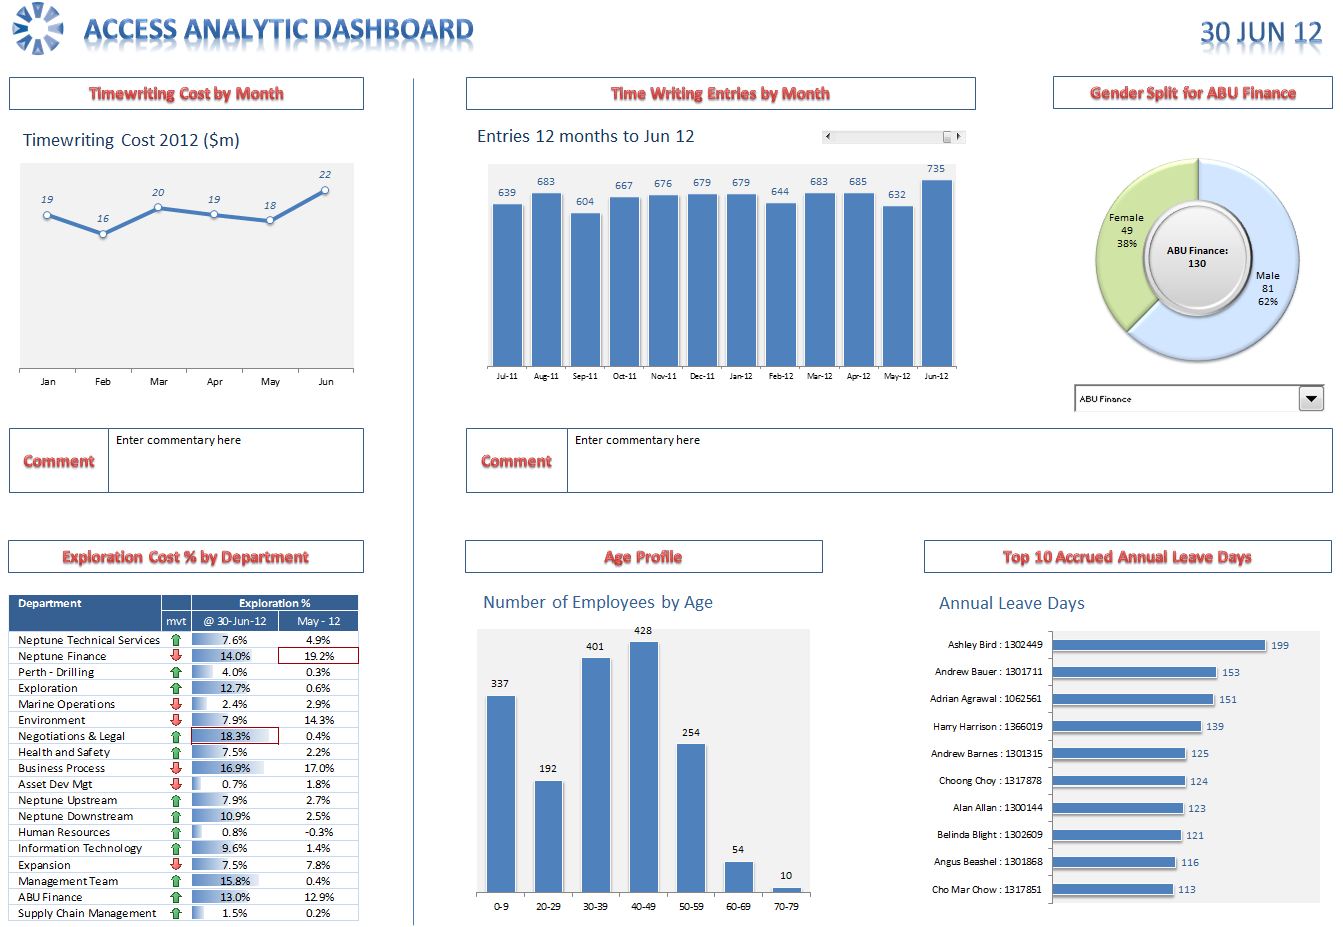
Example: Operations Dashboard
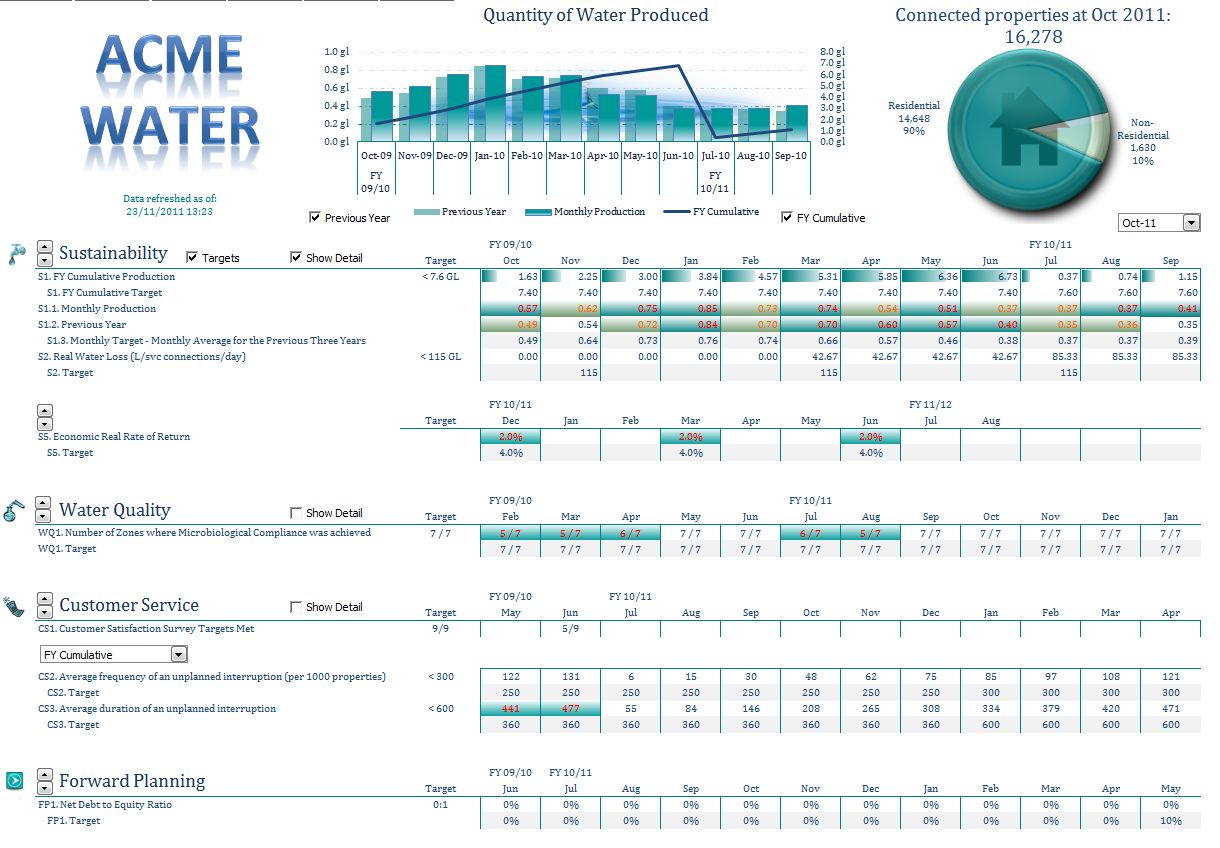
This client was looking for help in presenting both summarised and detailed operational information to its managers in an interactive format so they could analyse the performance of the organisation.
We worked with them to design an interactive Excel dashboard that connected to a variety of different back-end database systems, then brought all the information together in a single view that the managers could use to view different time periods, summary & detail, target & actual, and monthly & cumulative data.
Need Help?
At Access Analytic, we’ve built a wide variety of Excel dashboards and reports for all kinds of organisations over many years.
Here’s how we can help you:
- We help you identify your KPIs: what things are really worth measuring and how should they be reported?
- We connect data from all the various systems in your business and relate this together to facilitate better decisions that are based on data, help identify new revenue opportunities, reduce risks, and reduce costs.
- We design and help you implement this so you get maximum benefit.
- We provide ongoing support to adapt and expand and adapt the system as your business changes.