Mastering Dynamic Measure Formatting in Power BI | Part 1 – Flexibility with Visual Level Format String
By Melina Louzada
In the realm of data analysis, the clarity of data presentation is just as crucial as the data itself. Dynamic measure formatting in Power BI enables analysts to tailor data representations to enhance readability and insights. This blog 4-part series will navigate through a few techniques to dynamically change the formatting of values in Power BI based on the selected measure and its magnitude.
Before diving in, ensure you have the working Power BI file ready; it’s a vital starting point for following this guide step-by-step.
Getting Started
To follow along, download the starter file here and prepare your Power BI environment. The file contains unformatted data sets that we will transform using dynamic formatting techniques.
Power BI’s new visual-level format strings feature, now available in preview, although not necessarily dynamic provides users with more flexibility in formatting data visualisations.
This hierarchical approach means that visual-level format strings can be used to fine-tune data presentation, ensuring the exact formatting needed is applied to each visual component. To use this feature, enable the visual calculations preview in Power BI Desktop.
Step-by-Step Guide:
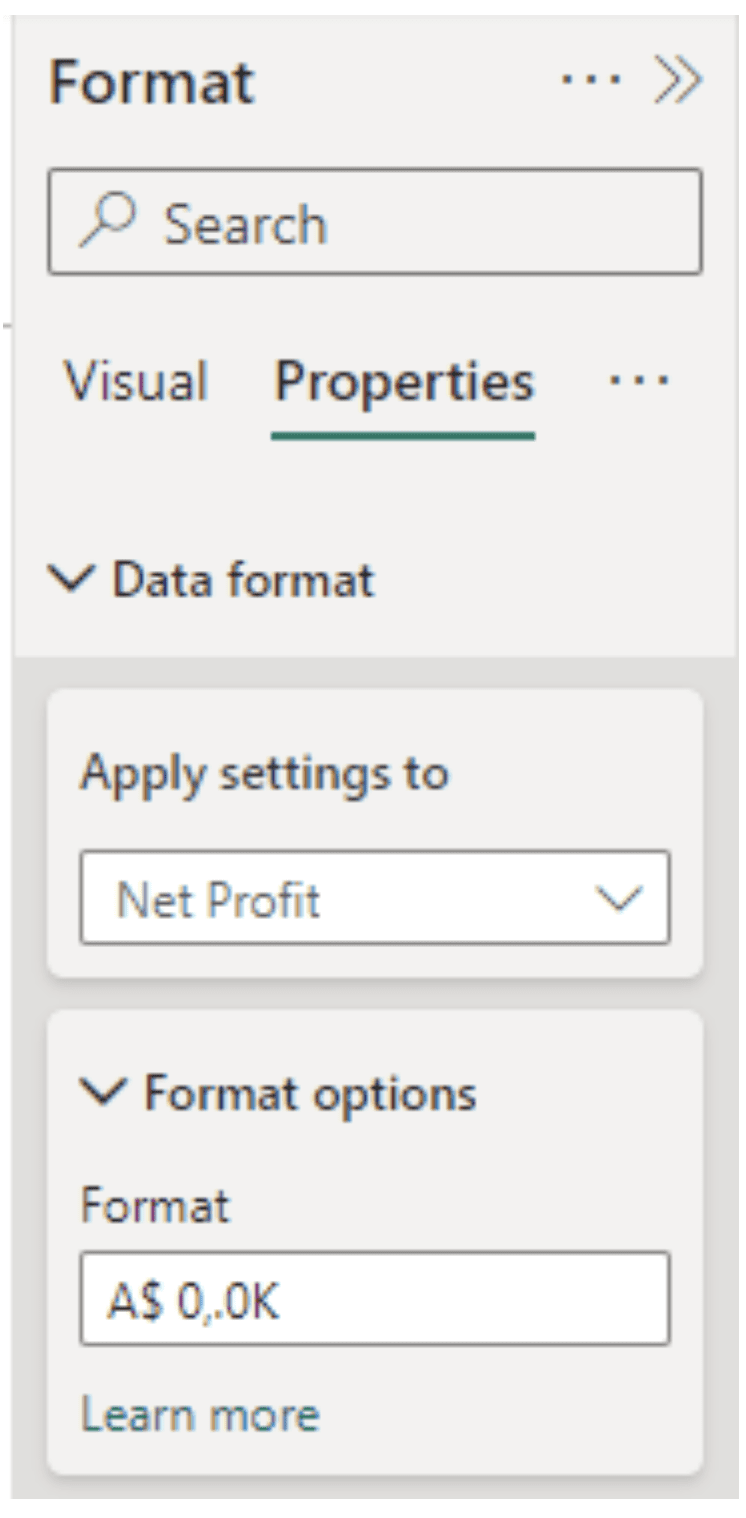
- Selecting the visual named “Net Profit – Visual Level Format String”, go to the “Format” pane and click on “Properties” and “Data format”.
- Select the measure / field you want the specific formatting for the visual to apply and type in the desired formatting options.


Pros and Cons
Pros:
- Flexibility to define custom formats for a specific visual without impacting any other visual where the measure is used.
- Simple to implement for a few measures
Cons:
- This is a static formatting and is not dynamic, which means you have no flexibility in modifying the formatting based on the values or other criteria like you do with the other options presented in this blog series.
- For now, visual level format strings required you to enter a .NET format string instead of a VBA format string. This is a temporary issue that will be resolved in a future release. Find more information on this link.
Applications
This functionality allows you to format visual calculations directly on the visual level, independent of the model, enhancing the customisation of data labels, cards, and slicers.
Next in the Series
Follow along and compare with the tab “End” in the working file provided. Note it contains the results from all 4 blog posts.
Stay tuned for Part 2: Dynamic Cell Colour Formatting, where we’ll explore how to make your data more visually engaging using dynamic cell color formatting!


