A guide for Non-Techies
Microsoft Fabric is a suite of applications and services designed for data management and analysis, much like how Microsoft Office is a collection of productivity tools. When an organisation subscribes to Fabric, its users gain access to a range of various integrated services.
Fabric is a comprehensive data platform designed to enable organizations to efficiently manage and derive insights from their data.
What problem does it solve and what value does it add?
Fabric helps to address these common issues faced by organisations:
- Data Silos & Complex Data Management: Fabric offers a unified data platform that integrates various data services. This reduces the complexity and cost associated with managing multiple disparate tools and systems. Data Silos are avoided as data from various sources can be integrated, stored, and analysed in one place
- Productivity and Collaboration: Fabric promotes productivity and collaboration by providing a consistent experience across its services, allowing data engineers, data scientists, and business analysts to work seamlessly together.
- Resource Constraints & Scalability: Fabric reduces the need for extensive infrastructure and expertise by providing a scalable, managed service, allowing organizations to focus on data value. The platform is designed to scale with the needs of the business, allowing organizations to accommodate growing data needs without performance degradation.
- Security and Governance: With integrated security and governance features, Fabric ensures that data is protected, and compliance requirements are met.

What’s included in Fabric?
Here’s a breakdown of what Fabric includes:
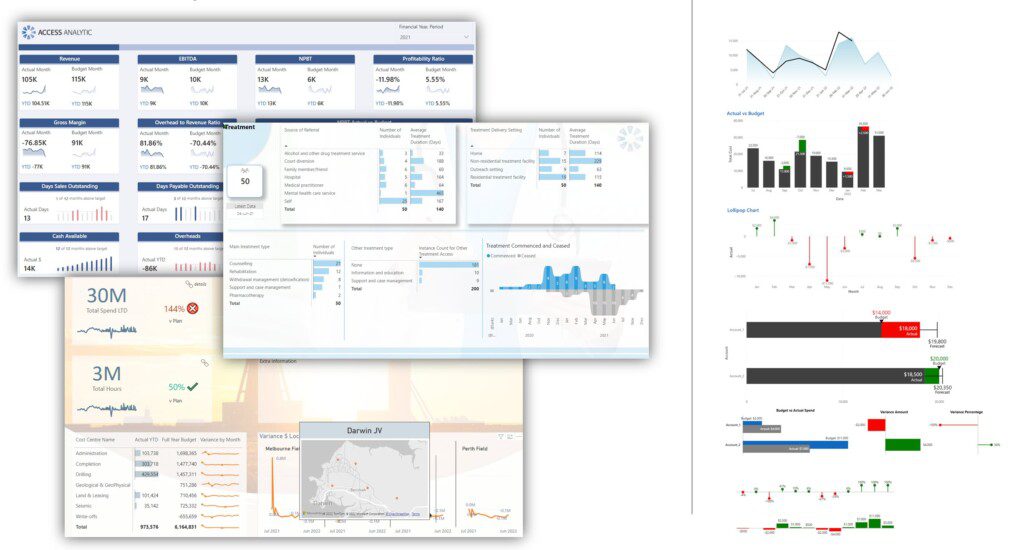
Power BI
Power BI is a powerful suite for reporting and analysis. It includes a desktop application for building reports and an online service for sharing and viewing them. The online service uses Workspaces, which are central to organising data accessible by Power BI, Excel, and other Fabric services, including Data Science. Power BI can also exist outside of the Fabric licencing via purchasing Pro or Premium Per User licences More on Power BI
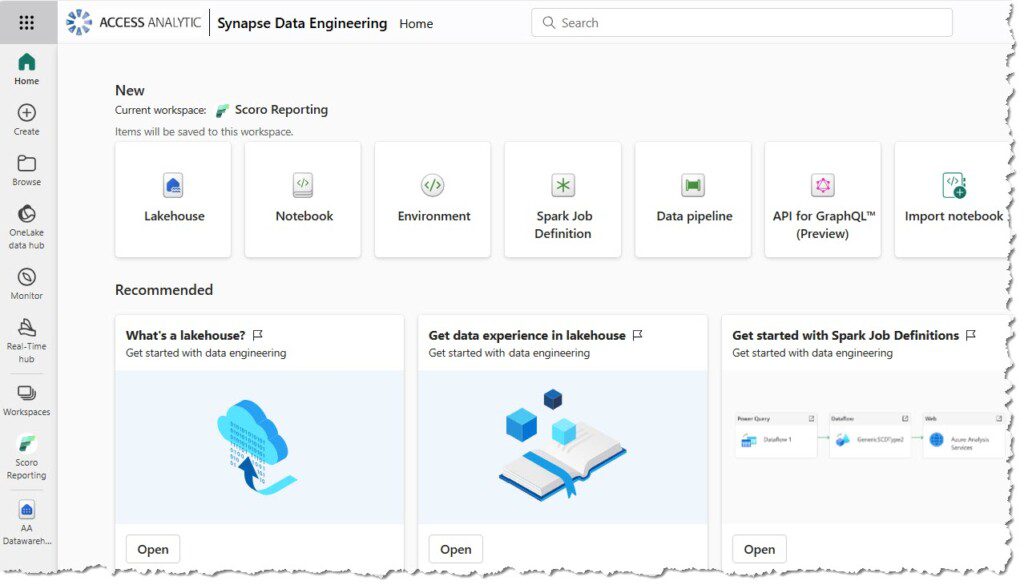
Data Factory & Data Engineering
Data Factory & Engineering deals with importing, transforming, and storing data at any scale. It is where you connect to raw data sources, clean the data, and load it into Lakehouse tables or Warehouses. The main methods for importing data are:
- Power Query (Dataflow Gen2)
- Spark Notebooks (Python or SQL)
- Copy Tool in Pipelines
Shortcuts and Mirroring can also bring data into OneLake. The entire process can be orchestrated using Data Factory in a sequence of steps known as a pipeline. Microsoft documentation
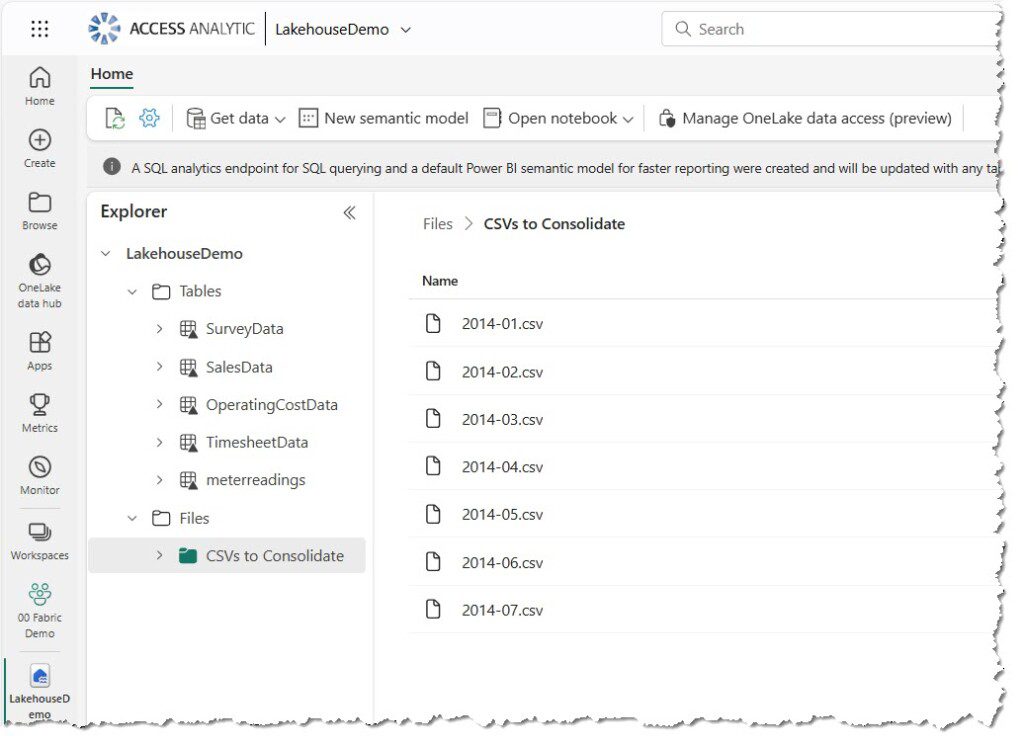
Lakehouses
Lakehouses provide organised storage for both unstructured source data and clean structured tables, which are highly compressed Delta Parquet Files. These files can be securely accessed by all other services in Fabric, provided permissions are granted. You can think of Delta Parquet files like super-optimised text / csv files.
Microsoft Documentation
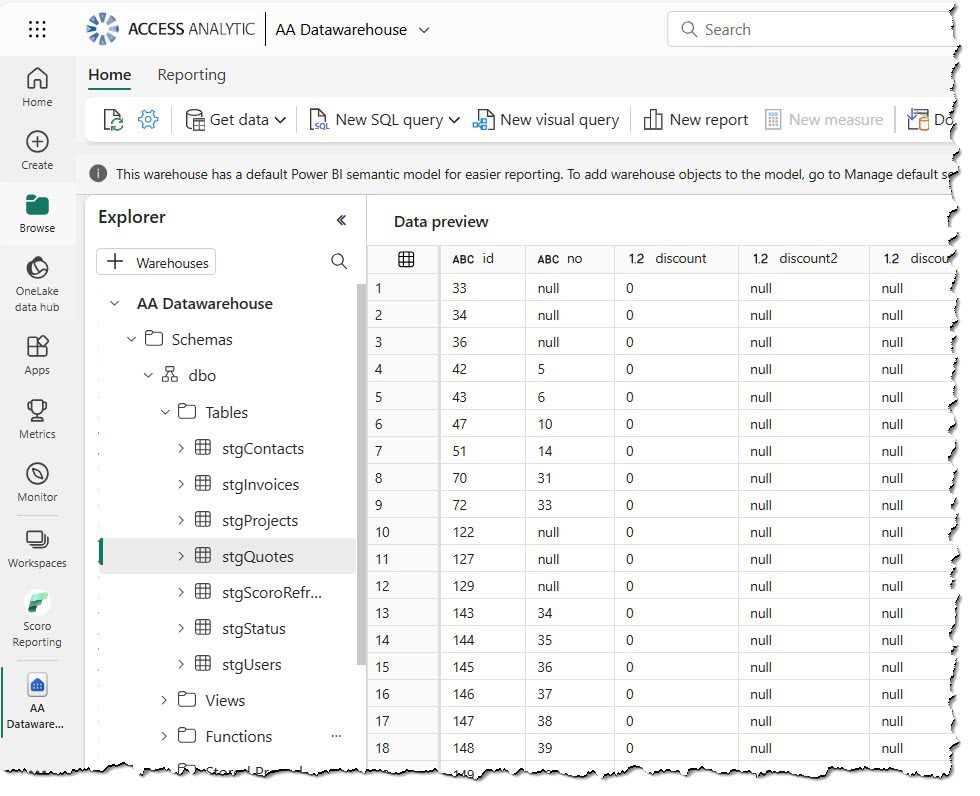
Warehouses
Warehouses are a more feature-rich environment compared to Lakehouses, offering write functionality and finer-grain control with full T-SQL capabilities. Warehouses are designed for handling structured data. They offer advanced features for organising, querying, and analysing structured datasets. While Lakehouses can handle both unstructured and structured data, Warehouses excel in environments where structured data management and analysis is the focus. Microsoft documentation
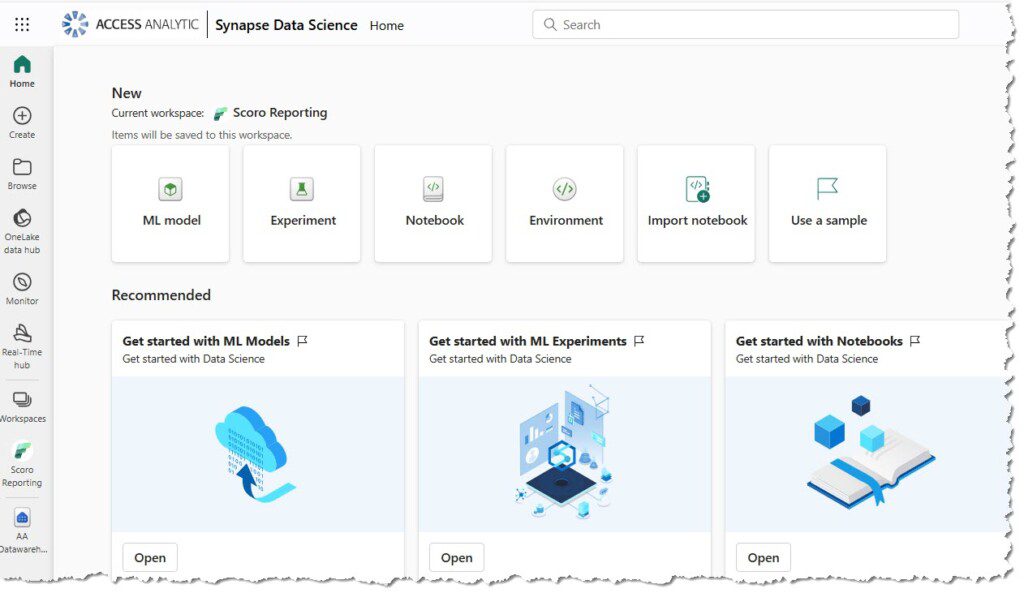
Data Science
The Data Science component supports machine learning and data science workflows to generate predictive insights. It provides tools and environments for data scientists to build, train, and deploy machine learning models, facilitating the extraction of actionable insights from data. Microsoft documentation
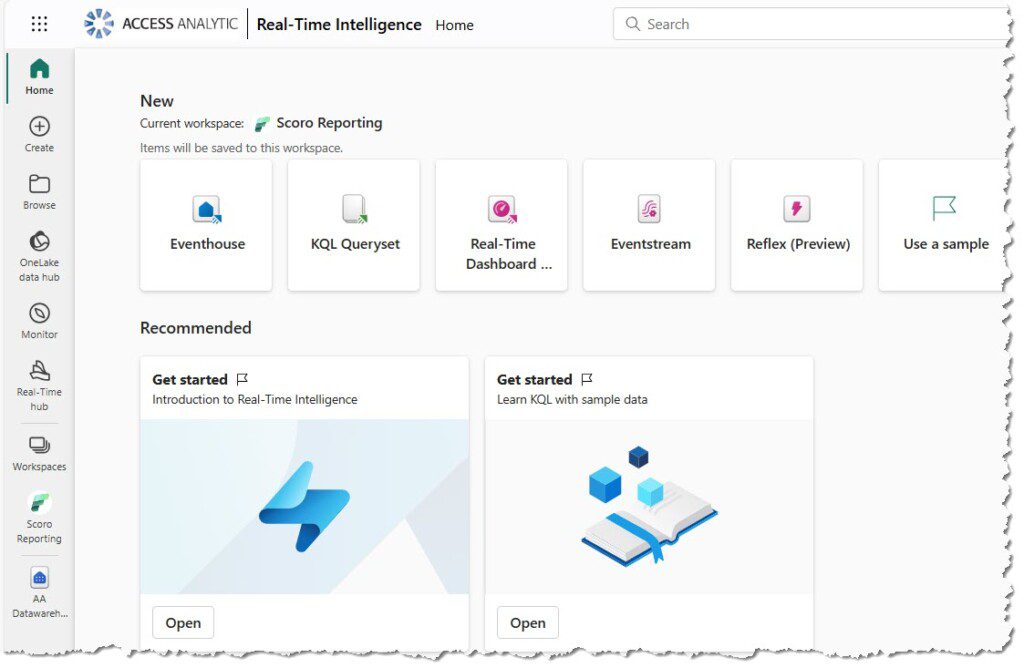
Real-Time Intelligence
Real-Time Intelligence involves data storage, triggers, and reporting for streaming data, such as sensors or activity tracking within Fabric. It leverages QKL databases to efficiently manage and process large volumes of real-time data. This includes Data Activator “reflexes,” a system that triggers actions based on events, like Power BI reports generating alerts or Fabric activities initiating workflows. Microsoft documentation
OneLake
OneLake is the underlying storage layer (“data lake”) for all data within Fabric. This consists of the raw data, clean tables, and curated models. Think of OneLake as being similar to OneDrive with its folder structure. Although you don’t interact with OneLake directly, you engage with it through Workspaces, Lakehouses, and Warehouses. It also offers the convenience of syncing files to your Windows desktop, just like OneDrive. Microsoft documentation
What are the different pricing options?
Microsoft Fabric offers two pricing options: reservation and subscription.
Reservation pricing allows customers to reserve a fixed amount of capacity for a year, offering approximately 40% savings compared to continuous subscription usage.
Subscription pricing allows customers to “Pay as You Go” for a set amount of capacity, which can be turned on and off as required. When turned off, no content can be accessed.
Check out our YouTube video on how to programmatically start and stop capacity on a schedule.
What is meant by capacity? More on that below.
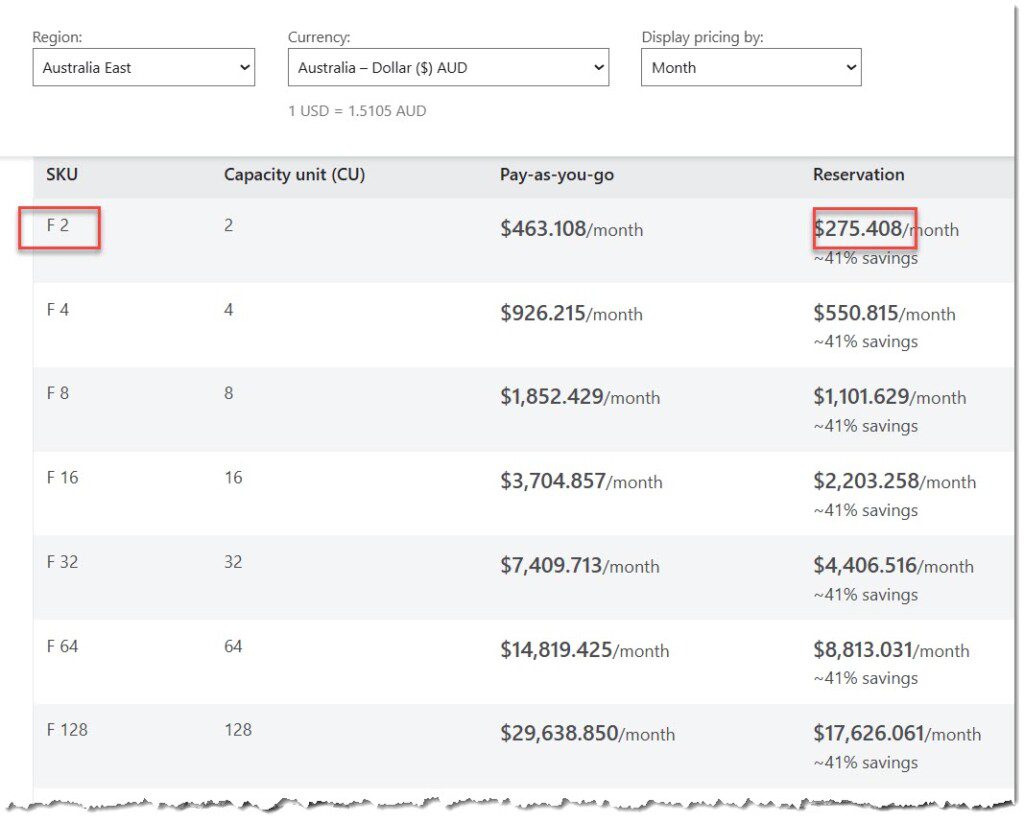
Capacity “SKUs” – Stock Keeping Units
Buying a SKU (pronounced skew) provides a set amount of Capacity Units (CU) where each CU gives you 3,600 compute seconds per hour. An F2 SKU provides 7,200 seconds per hour at AUD $275 / month if paying for continuous access
Link to pricing page
How many Capacity Units do you need?
Determining the number of seconds, and therefore CUs, required can be challenging. We offer guidance and testing to establish a recommended starting point. Activities such as running dataflows, creating Lakehouses, or viewing Power BI reports consume varying amounts of compute seconds.
For example, running a moderately complex dataflow on a set of data that takes 1 minute to refresh can use 4,000 seconds of compute, while creating a simple Lakehouse might incur 6,000 seconds, and viewing a Power BI report might use 300 seconds. Note these numbers are completely made up and will be specific to your activity.
Premium SKUs
You’ll notice from the earlier screenshot that F64 and above are marked as Premium. These SKUs come with additional features, especially for Power BI users, eliminating the need for pro licences for report viewers supporting larger models, more refreshes, and advanced developer functionality.
Copilot
To use Power BI Copilot, a premium SKU is required. Copilot assists in building reports, writing DAX and answering questions based on reports. It will consume CU seconds, which will need careful monitoring Power BI Blog.
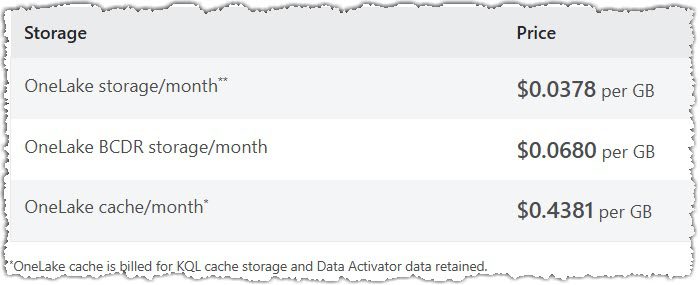
Storage costs are not likely to be a significant consideration coming in at AUD$0.50 per GB per year
Power BI reports, semantic models, dataflows and paginated reports that do not utilise Fabric features such as Direct Lake mode are covered by the Power BI licence (up to 10GB per pro licence or 100 TB for premium capacity) and do not count towards the OneLake storage cost.
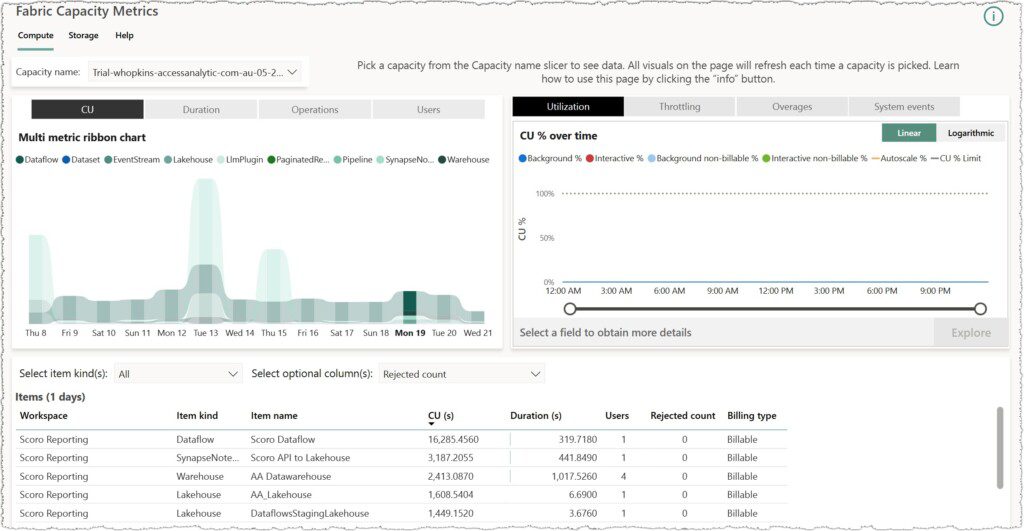
Monitoring of your usage in Fabric is critical. Microsoft provides a pre-built Capacity Metrics App to help identify capacity issues and optimise usage. But it is currently limited and generic.
We can customise the reporting to better inform you based on your use case.
There are various strategies and techniques to minimise the amount of capacity you need to use, from optimising your model and dataflows, to utilising notebooks and locating your Power BI reports in the right types of workspaces.
Summary
Microsoft Fabric provides significant business value by offering a unified, scalable, and secure data platform that addresses common data management challenges. It enables organizations to derive deeper insights, improve collaboration, and respond quickly to new opportunities, thereby driving innovation and competitive advantage.
How Access Analytic can help you?
Whether you are starting from scratch or migrating existing solutions the team at Access Analytic can help you.
- Fabric Kick Start Proof of Concept
- Quick results to demonstrate Fabric’s value.
- Fabric Costs / Usage Reporting and Optimisation
- Deploying customised reports to track usage and optimise capacity.
- Recommending and / or implementing optimisation solutions to lower cost or free up additional capacity.
- Fabric Monthly Showcase
- Keeping you updated with the latest Fabric features and providing hands-on demonstrations.
Contact us now to arrange a free initial discussion.