How to use Icon Sets in Power BI and Excel

By Wyn Hopkins If you find the default Icon settings confusing in both Excel and Power BI, you're not alone! In July 2019 conditional formatting Icon Sets were added to Power BI and it caused us to revisit how they work in Excel. In Excel you would highlight a range of numbers and choose Conditional [...]

Dynamically consolidate multiple ranges

By Yury Tokarev Dynamically consolidate multiple ranges when loading Excel files from Folder in Power Query We've come across a task where we need to consolidate a client's budget data from Excel files, each representing a division, where any of the files may have multiple similarly structured tabs with sub-divisional data. In our [...]

Excel Summit hits Perth

Excel Summit South is hitting Perth The biggest Excel event ever to hit Perth is coming on the 8th & 9th of August 2019. If you love Excel or want to make the most of the technology your organisation is already paying for then you cannot miss out on this. Multiple MVP's and Microsoft staff [...]

We’re going to SQLSaturday 2019

  SQLSaturday training event Access Analytic is once again happy to be involved in SQLSaturday. This event brings together Microsoft Data Platform professionals and those wanting to learn about SQL Server, Business Intelligence and Analytics. To find out more visit SQLSaturday here.  

Power Pivot basics

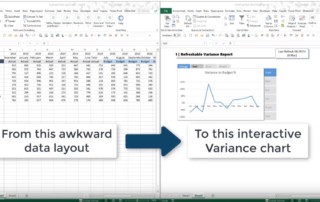
Power Pivot basics plus a Power Query technique for handling awkward data Something for everyone in this video, showing how to take awkward source data, transform it using Power Query and produce an interactive variance report in Power Pivot. The pre-built template we used is available for free from our website along other cool downloads [...]

Voice generated Power BI Mobile report

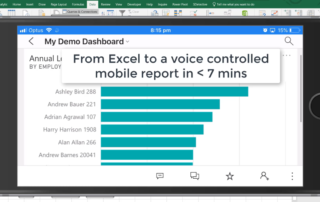
Move over Siri, Alexa Get information from your Power BI reports faster by using your voice. Excel file to a voice generated Power BI Mobile report. Learn how in less than 7 minutes! Here's how to build a voice generated report on a mobile starting with Excel and ending in Power BI Mobile . It [...]

10 Million rows of data in Excel?

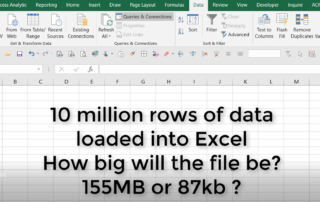
Loading 10 million rows of data into Excel We believe it's important that business users of Excel understand what it's truly capable of. Only then can they make informed decisions about if/where to invest in new software, what staff training is required and how the business can be more efficient. Excel is capable of dramatically [...]

VLOOKUP and INDEX MATCH

VLOOKUP v INDEX MATCH - You decide Let's think of VLOOKUP as a screwdriver and INDEX MATCH as a power drill... wait...wait.... I'm not saying INDEX MATCH is faster than VLOOKUP that isn't what this analogy is leading to. If  I need to screw something together I just pick up the screwdriver and hey-presto done.  [...]

Percent of group in Power Query

Percent of Group in Power Query (plus an Excel Table version) Power Query saves you days of time manually manipulating messy data. This leads to improved productivity and efficiency. A quick tip to save you time is to generate a % of group total. It's relatively straightforward in Excel, but it's trickier in Power Query. [...]

Connect to files on OneDrive and Sharepoint

Connect to Excel files using Power Query Power Query can connect to Excel files held in OneDrive for business and in SharePoint. But it's not obvious how. Whether you use Excel or PowerBI this approach will work. Also, for a pure  "M" code approach to SharePoint you can use something like this to get your data [...]

Learn from highly qualified finance professionals with international experience

Reach out to the Access Analytic team Monday to Friday on (08) 6210 8500 or submit your contact information and we will be in touch.

Get Ahead of the Game – Book Your Training Now!