The easiest ways to add a new data series to an existing Excel chart

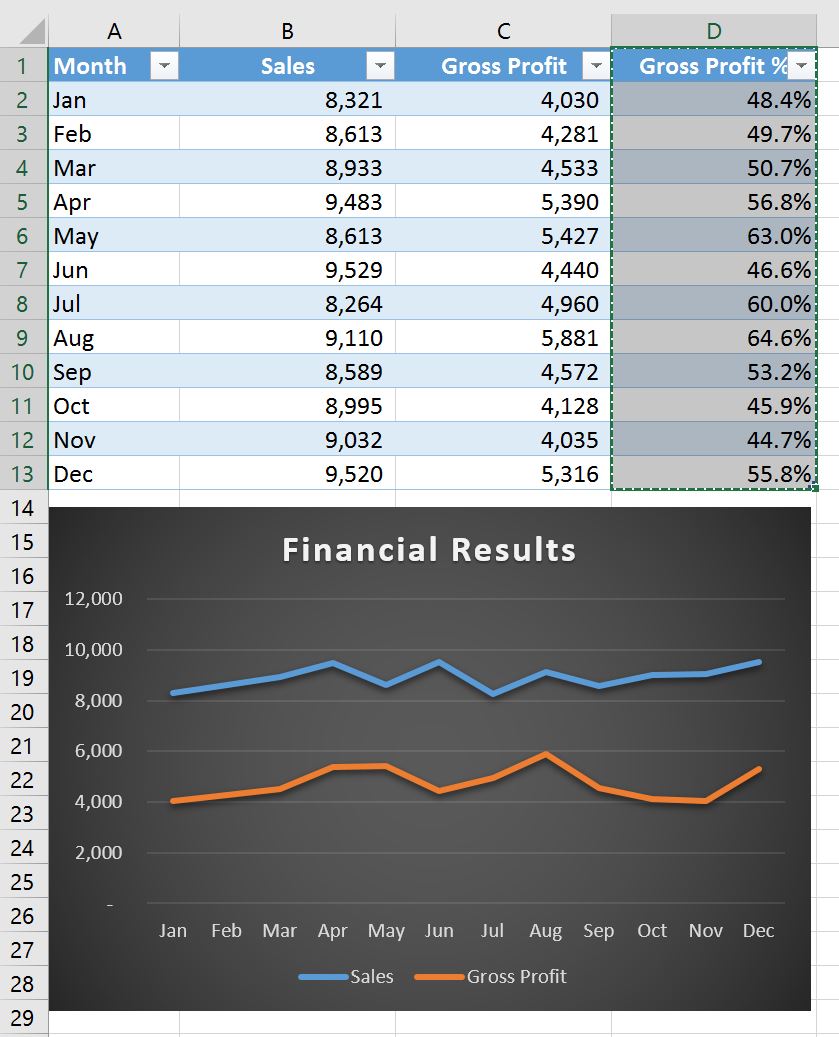
There are lots of ways to add a new data series to an existing Excel chart.  Here are what we suggest are the two easiest ways: Method 1: Copy & Paste Great if your data series aren't in a table or aren't adjacent to each other. 1. Select your data (including the heading) and copy this [...]

2017-03-08T03:53:54+08:00Charts|

 Stop Zeroes Displaying On Line Charts

Stop zeroes displaying on line Charts I have a line chart which has all the months of the year displayed. Each month is linked to a data cell. This means that future months display zero values. The line chart drops down to zero for these future months. Instead of having to change the chart [...]

2017-11-02T16:02:30+08:00Charts|

 Using Text Boxes On Charts

Using Text Boxes on Charts I use text boxes to put notes onto charts. But if I move the chart the text boxes don't move with it. Is there an easy way to achieve this? By Neale Blackwood There are a couple of solutions to this problem. The first uses the Ctrl key to [...]

2017-03-08T03:53:59+08:00Charts|

 REPT Function – Create A Cell Chart

REPT function - create a Cell chart Is it possible to use a cell to display a bar indicator like a bar chart, based on another cell's value? By Neale Blackwood The REPT function allows you to repeat a character a defined number of times. If cell A1 contained 65, the following formula [...]

2017-03-08T03:53:59+08:00Charts|

 Organisation Chart

Organisation Chart Built-in feature By Neale Blackwood Ever needed to create an Organisation Chart but don't have Visio? Have a look at Excel's built-in Org Chart creator. Click Insert menu > Diagrams and select the Org Chart. Use the drop downs on the toolbar to add to the chart. The AutoFormat button has a [...]

2017-03-08T03:53:59+08:00Charts|

 Create A Flow Chart

Create a Flow Chart Built-in feature By Neale Blackwood, 30 Apr 15 Do you need to draw a Flow Chart or document a process? In Excel 2003 and earlier versions, right click the toolbar and select the Drawing Toolbar. In the toolbar there is an AutoShapes button. Click that to see a list of [...]

2017-03-08T03:54:00+08:00Charts|

 Data Point Label

Data Point Label Labelling a single data point By Neale Blackwood Did you know that you can label a single data point on a Line chart? This may be the highest, lowest or last data point on the line. You may want to label it to highlight a specific issue. To get a label [...]

2017-03-08T03:54:02+08:00Charts|

 How To Create Interactive Infographics

How to Create Interactive Infographics By Jeff Robson (requires Excel 2010+) Normally InfoGraphics are just static PDFs ... but wouldn't it be great if they were a bit more useful and you could change them to see the specific things you're interested in?   This example lets you choose a Country, then [...]

2017-03-08T03:54:05+08:00Charts|