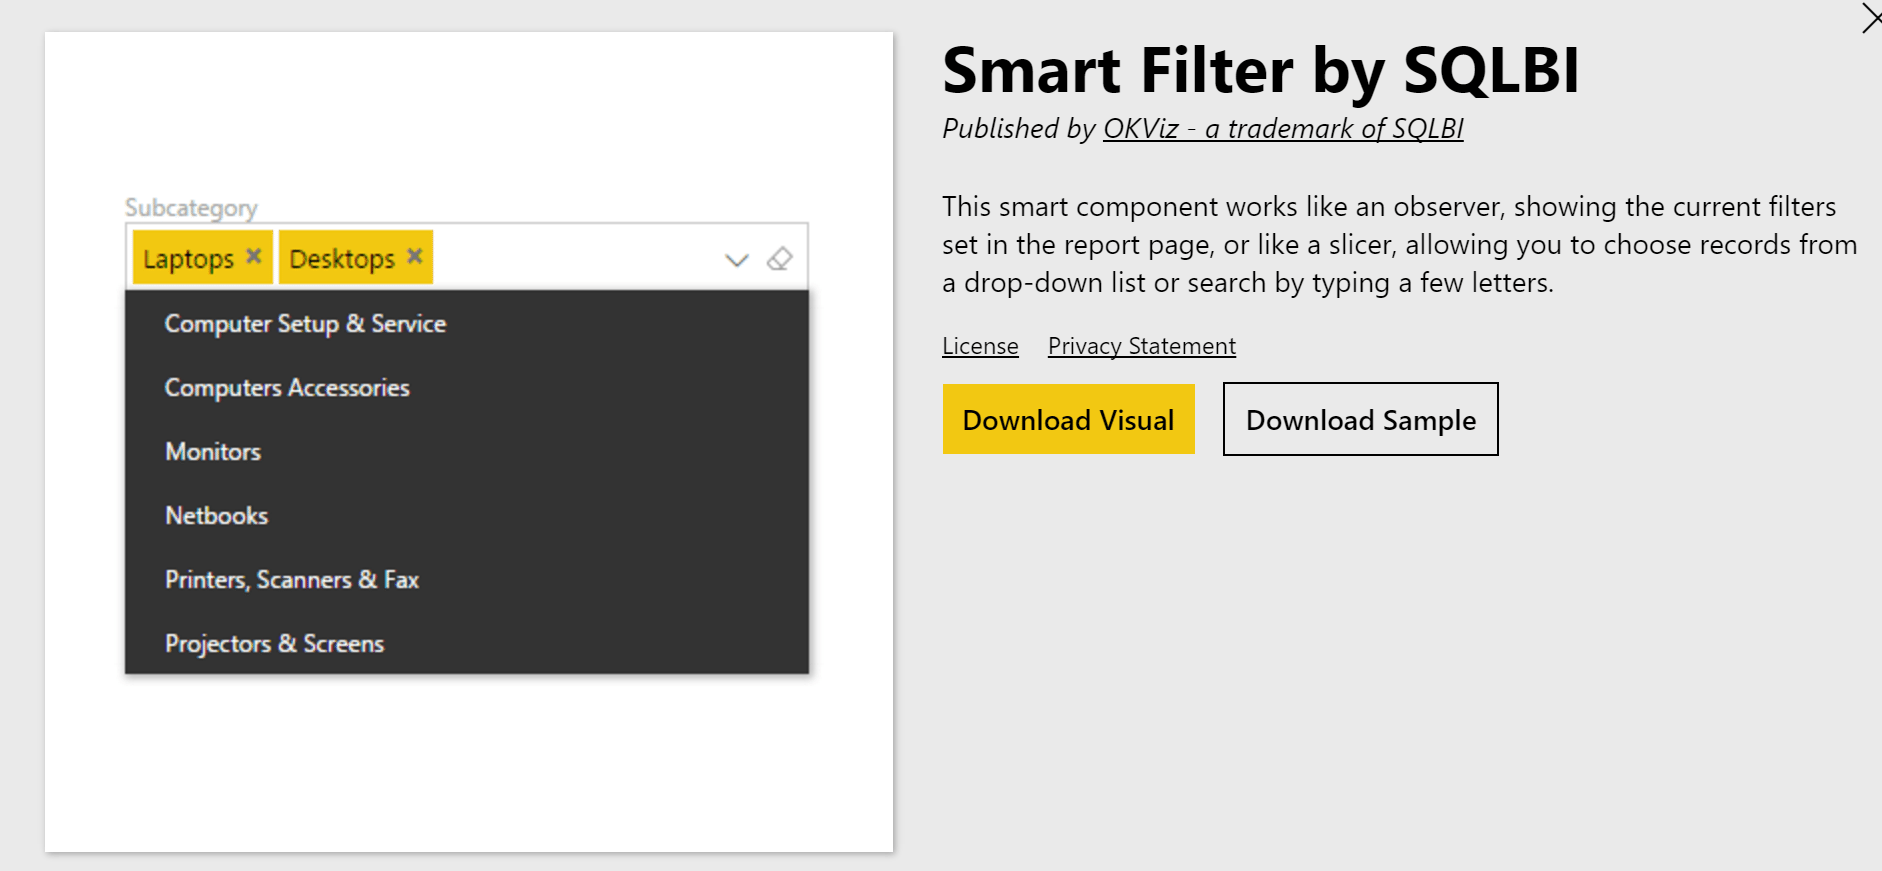
One of the great things about Power BI visualisations is the fact that they are open source and clever generous folk are developing fantastic tools for free that can help us all deliver a more enjoyable experience to the end users.
Two of my current favourites are both by OKVIZ and are beautiful in their simplicity
1 Smart Filter

http://okviz.com/smart-filter/
2 Card with Status (States)

http://okviz.com/card-with-states/
If you are into Excel and you haven’t started exploring Power BI yet then you’re missing out.
If you are into Excel and you haven’t started exploring Power BI yet then you’re missing out. The Power Query and Power Pivot technology that is now embedded into Excel 2016 (add-ins available for earlier versions) is the engine behind Power BI Desktop.
Power BI Desktop provides you with an awesome “dashboarding” layer for information sharing.
Once you’ve built a dashboard in PowerBI Desktop then a couple of clicks allows you to publish this to PowerBI.com and all of a sudden your reports are available on any device (laptop, tablet, mobile) to anyone you’ve given access to.
Why Power BI is our friend
The real killer feature of Power BI is that it builds on those Excel skills that have taken so long to develop and encourages Excel users to take extra steps to really make their skills shine.
All too often competitor BI tools demonise Excel as some evil make-do child’s toy that is no longer fit for purpose in this “Big Data” era. Far from it, Excel is the most widely used BI tool in the world and always will be, especially with the integration of Power Query and Power Pivot.
So try out Power Query (Get & Transform) and see how much time it can save you, then explore what magic is possible when you start loading data into Power Pivot, and finally step into the world of Power BI desktop and Power BI.com to start to share your hard work and insights with the rest of your department and organisation.
Its’ any amazing journey that will stand you in a great position for many many years to come.


