by Jeff Robson
Challenge of the month – Flex your Power Query Skills
From time to time, we post fun, technical challenges in Excel & Power BI.
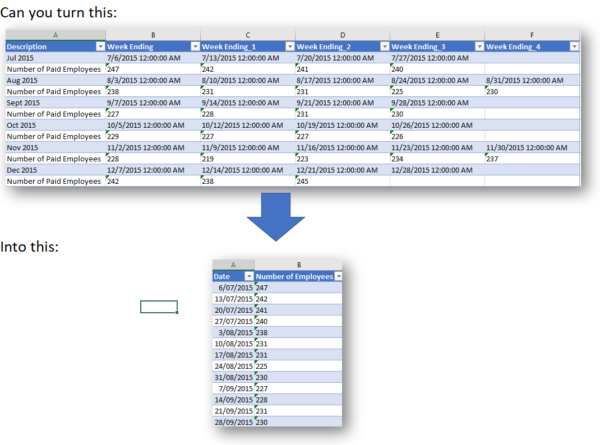
In this one, you start with a dataset where every second row is data and the rows in between are column headings. Can you turn this into two columns of data: dates and data?
Accept the challenge below with our free download.
Winners and Solutions Announced!
Congratulations to all who participated in this challenge! We received some excellent entries & a very wide variety of approaches, which illustrates the range of different ways Power Query can be applied to achieve the same result.
Some of the entries used multiple tables, some extracted alternate rows, some used various pivot combinations & indexes to match up everything in a single table.
If you’d like to see some of the approaches people took, take a look at the files below.
Because of the quality of the entries, we decided to accept the top 12 submissions this time so huge congratulations to our winners (in no particular order):
- Cristian Angyal
- Jerry Ball
- Pathe Bah
- Tze Sheng Yeo
- Konrad Schafers
- Kevin Phan
- Peter Bartholomew: Power Query Solution, Excel formulas Solution
- Gary Letts
- Neale Blackwood
- Morten Ostergaard Lauritsen
- Chris King
- Frik Lloyd
*We even received a solution that just used Excel formulas with a mixture of dynamic arrays, LAMBDA & LET (thanks Peter!)
Thanks to everyone for participating & stay tuned for the next one!


