Power Query (Get & Transform) – Video Introduction Part 2

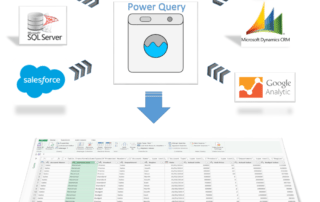
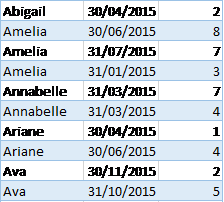
Power Query (Get & Transform) - Part 2 In part 1 I demonstrated how Power Query can quickly consolidate all of the files in a folder and bring that data into Excel. In this 6 minute video I follow on from that introduction and add an extra transformation step to get the dates I need. Once [...]

Power Query (Get & Transform) – Video Introduction Part 1

Power Query (Get & Transform) Part 1 Power Query is amazing at linking to data sources and cleansing / transforming that data as it's loaded into Excel (or Power BI Desktop). Watch this 4 minute video and see how you can consolidate all of the files from a folder instantly using Power Query. Build the transformation steps [...]

Excel Dependent Drop Downs

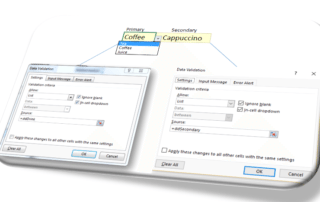
  Dependent Drop Down Box How to do one of those trickier tasks in Excel: set up a drop down box that is dependent on the result of another drop down box. The scenario If coffee is selected from drop down A then I want a list of coffee types to appear in drop [...]

Easy Cumulative totals in Tables

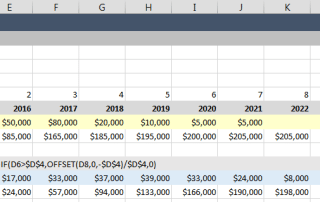
Easy Cumulative totals in Tables The single greatest advancement in Excel in the last 10 years was the introduction of Tables.  Yet although Tables were introduced in Excel 2007 there is still a huge number (I'd even say the majority) of Excel users that don't know how to create tables or understand what they do. This [...]

When one Excel session just isn’t enough!

By Wyn Hopkins This simple tip may save you a lot of time and effort, but it must be used carefully. With the arrival of Excel 2013 we were finally able to easily split Excel between two screens and happily copy and paste between the two with full paste capability and without the worry of worksheet [...]

Combine multiple tables with Excel Power Query

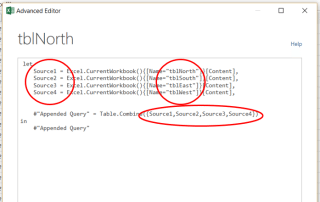
How to combine multiple tables with Excel Power Query If you have multiple tables of data in a file and you want to view a single report based on these tables then it can be time consuming and risky to manually copy and paste them into a single table before creating pivot [...]

3 Easy Steps to Create Waterfall Chart in Excel 2016

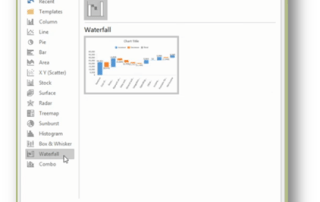
Create a Waterfall Chart by Yury Tokarev A waterfall chart is a great way to represent financial inflows and outflows. Yet, it is a daunting task to create this in Excel versions up to 2013 (see links below for help!). The good news is that Excel 2016 has taken all the complexity away. [...]

2017-03-08T03:53:55+08:00Excel 2016|

If you’re not Modelling Depreciation like this, you’re doing it the hard way!

Depreciation is one of those concepts that sounds easy and simple … until you try to put it into a financial model! In this blog, we start with Excel’s standard depreciation functions, then show two much better, more functional and more elegant ways to calculate depreciation. 1. Excel Functions Excel has some [...]

The Top 3 New Features of Excel 2016

The next version of Microsoft Office is just around the corner and we’re nearly as excited as this girl! So here are the top 3 new features (according to us) … let us know if you agree (download preview). 1. Cool new charts Check them out! 2. More Powerful Power Query Power Query has been with [...]

The Top 3 New Charts in Excel 2016

Love them or hate them, Excel charts have always been a key feature.  They're a powerful way to visualize data, communicate trends, and highlight anomalies. Excel 2016 has taken charts to a whole new level by adding several charts that users have been requesting for many years! Here’s a quick tour of the top 3 [...]

Learn from highly qualified finance professionals with international experience

Reach out to the Access Analytic team Monday to Friday on (08) 6210 8500 or submit your contact information and we will be in touch.

Get Ahead of the Game – Book Your Training Now!