
3 Signs your Company’s Management Reporting Needs a Massive Overhaul
How much time does your organisation spend each month preparing budget and management reports?
How much time does management spend trying to understand these reports?
How much money does your organisation spend on reporting solutions?
Do any of the following reporting problems sound familiar to you?
Your reports are repetitive, error-prone and time-consuming to produce
- Creating each report is a long, manual process involving downloading information from multiple systems, copying and pasting values into Excel, formula troubleshooting, and endless re-formatting to make everything look nice.
- All steps have to be repeated each month or time the report is due.
Your reports aren’t necessarily relevant to each user’s needs
- You may have produced a report containing lots of financial information and then explain the report to a manager who isn’t responsible for financial KPIs.
Your reports don’t contain enough specific information
- Significant trends in reports may be hard to notice, especially if the reports don’t contain chart visuals.
- Even if chart visuals are included in the report and show a large trend downwards or upwards, your end user needs to know the specific causes of the trend! Static chart visuals won’t tell you this information.

How do businesses solve these reporting problems?
If you need quick, specific insights from your data to help drive better decision making in your business, you should strongly consider using Power BI as the solution for your reporting needs.
Here’s how Power BI can solve these three major problems:
Solution #1: Reports that automatically refresh based on user preferences
Power BI can connect to virtually any data source, eliminating the need to copy and paste information from different sources.
Once a Power BI report is created, there’s no need to re-create the report next month by reloading, re-cleaning and re-transforming a new set of data – just click refresh (or setup auto-refresh) to update your reports!
Power BI reports are also easily and securely shared with others in your organisation via PowerBI.com, which means no need to email spreadsheets back and forth and keep track of version control anymore!
Solution #2: Relevant, customisable reporting to satisfy different user needs
Power BI reports can be customised so that only certain data appears in the report for Manager A, Manager B, and so on, which eliminates the need to create different reports for different users of the same data set.
Once a report has been published to PowerBI.com, each report user can create their own interactive visualisations with the data via PowerBI.com, and pin these visualisations to dashboards for ease of use.
There’s also no need to worry about users accidentally changing a formula, as calculations are all set-up by the data model creator before the model is published to PowerBI.com.
Solution #3: Stunning, interactive visualisations that provide specific, relevant information
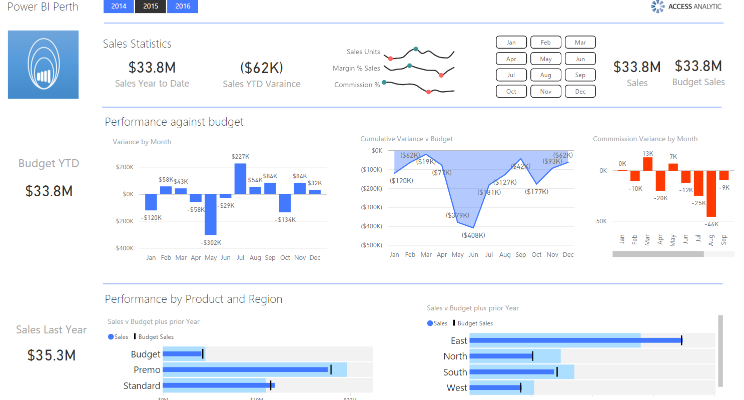
The AMAZING, interactive Power BI visualisations quickly help users identify trends in their data that need attention. Users can then click on a trend in a chart to filter other charts on the same page to identify the specific information explaining that trend.
One report containing 8-10 Power BI visualisations is like having over 100 reports all in one page! Why don’t you try and experience this for yourself? Take a look at a report in action.
At Access Analytic, we are passionate about using Power BI to transform data and create relevant, reliable and AMAZING solutions for clients. Why not engage us today to find out more?
Related Posts:
 Excel Office Scripts for Effortless Data Movement
- Unleash the Power of Cloud-Based Budgeting &…
- Complete guide to making faster, better decisions with…
- Navigating the New Normal: Why CFOs are embracing Data…
- 10 Ways to Know If Your Budgeting Process Flow Is Broken
- Dynamic Data Validation with Tables in Excel


